Home
About
  • Visualising the Berlin Train Network

    Jakob Apr 14, 2021 Data Visualisation R Berlin Graphs

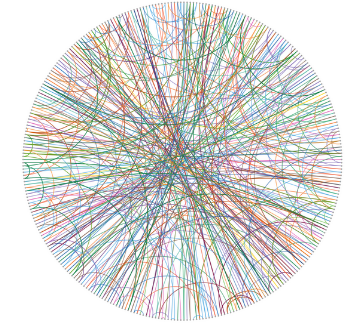
    A few years ago I came across this very concise but intriguing post on Antonio Sánchez Chinchón’s blog which features a beautiful matrix visualisation technique (as well as a Calle 13 quote). Ever since then I had it on my to-do list to build a similar visualisation but could never quite decide on which matrix I wanted …

    Read More

Natural Blogarithm

Data science, statistics, sports analytics, and other nerdy things
Read More

Featured Posts

  • Making my Photo Collection Searchable by Keywords
  • Guest Post about Fraud Detection on AWS Blog
  • Calculating Variance: Welford's Algorithm vs NumPy
  • Modelling the Relationship Between Restaurant Review Texts and Point Ratings
  • Visualising the Berlin Train Network
  • Sentiment Analysis for Restaurant Reviews in Stockholm and Berlin
  • Comparing Restaurant Reviews in Stockholm and Berlin
  • Does Predictor Order Affect the Results of Linear Regression?

Recent Posts

  • Making my Photo Collection Searchable by Keywords
  • Guest Post about Fraud Detection on AWS Blog
  • Calculating Variance: Welford's Algorithm vs NumPy
  • Modelling the Relationship Between Restaurant Review Texts and Point Ratings
  • Visualising the Berlin Train Network
  • Sentiment Analysis for Restaurant Reviews in Stockholm and Berlin
  • Comparing Restaurant Reviews in Stockholm and Berlin
  • Does Predictor Order Affect the Results of Linear Regression?

authors

JAKOB 8 STEPHAN 1

series

RESTAURANT-REVIEWS-ANALYSIS 2

tags

R 5 PYTHON 3 MACHINE-LEARNING 2 NLP 2 ANNOUNCEMENT 1 APIS 1 AWS 1 BERLIN 1 BERT 1 BLOG 1
All Tags
ANNOUNCEMENT1 APIS1 AWS1 BERLIN1 BERT1 BLOG1 COMPUTER-VISION1 DATA-VISUALISATION1 EMBEDDINGS1 FRAUD-DETECTION1 GEOSPATIAL1 GRAPHS1 MACHINE-LEARNING2 META1 METAFLOW1 MODELLING1 NEURAL-NETWORKS1 NLP2 PYTHON3 PYTORCH1 R5 REGRESSION1 SAGEMAKER1 SENTIMENT-ANALYSIS1 SIMULATION1
[A~Z][0~9]

Copyright 2025 Natural Blogarithm. All Rights Reserved